
FREE Winter CER Activities: Blizzards, Inversions & Power Grids | Middle & High School for 2025 & 2026
Winter weather offers perfect opportunities for data analysis, if you have the right resources. Students see blizzard warnings and power outages on the news, but do they understand the science behind wind chill calculations, temperature inversions trapping pollution, or why electrical grids fail during extreme cold?
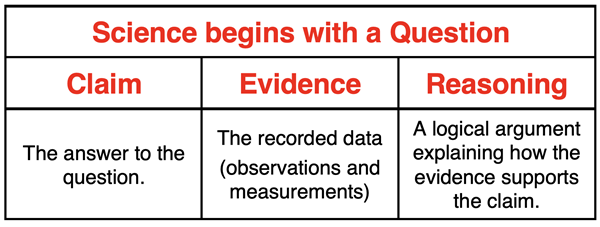
We've created three FREE Claim-Evidence-Reasoning activities featuring authentic winter weather data that transform abstract concepts into concrete analysis. Each activity includes multi-variable graphs, scaffolded CER prompts, complete standards alignment, and detailed sample student responses that model strong scientific reasoning.
Here's how these resources bring winter science to life in your classroom.
 [Download FREE Winter CER Activities]
The Winter Data Analysis Challenge
Your students can probably define a blizzard or describe how pollution affects air quality. But ask them to analyze multi-variable data showing how wind speed transforms -8°F into a life-threatening -42°F, or why temperature inversions cause air quality to deteriorate from "good" to "unhealthy" in just three days, and you'll discover their analytical skills need development.
The missing piece? Practice with real scientific data that tells compelling stories about phenomena they experience.
Three Winter Phenomena, One Comprehensive Resource
Our FREE winter CER activities provide authentic data analysis practice across three critical topics:
Activity 1: Wind Chill and Blizzard Safety
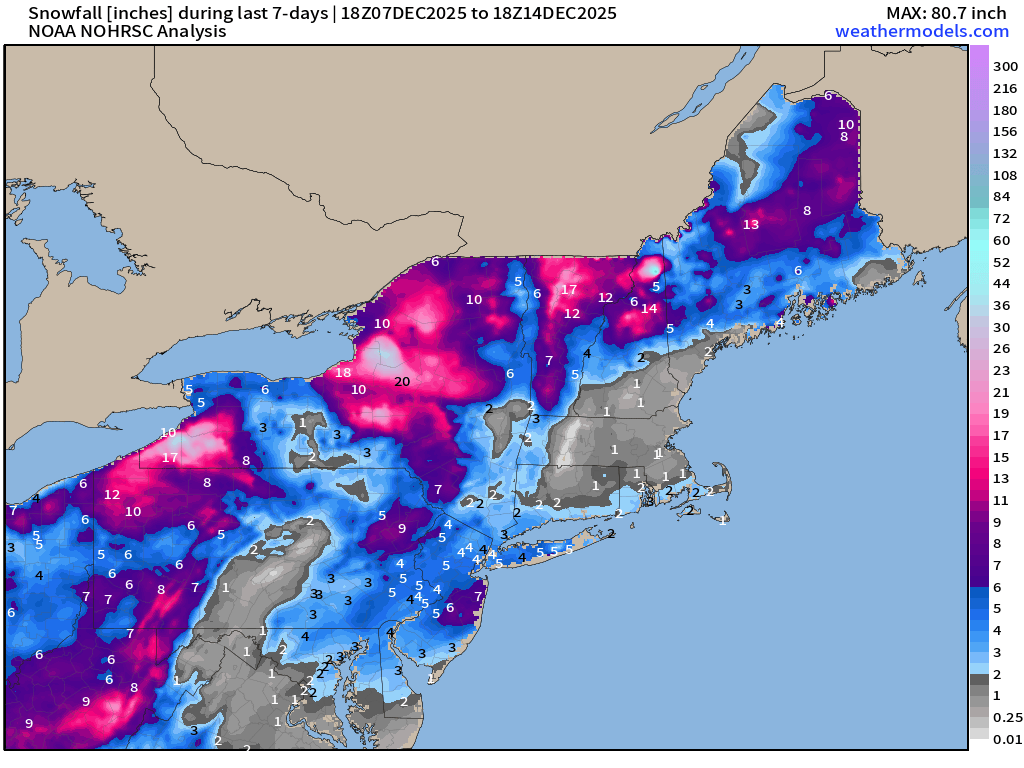
Image courtesy of Dr. Ryan Maue (X @RyanMaue X @weathertrader)
Students analyze 24-hour blizzard data tracking actual temperature, wind speed, wind chill temperature, and snow accumulation. They discover how 50 mph winds create 30-40°F temperature differences and why frostbite timing matters for winter safety.
- MS-ESS2-5: Collect data to provide evidence for how the motions and complex interactions of air masses results in changes in weather conditions
- MS-ESS3-3: Apply scientific principles to design a method for monitoring and minimizing a human impact on the environment
- HS-ESS2-4: Use a model to describe how variations in the flow of energy into and out of Earth's systems result in changes in climate
- HS-ESS3-4: Evaluate or refine a technological solution that reduces impacts of human activities on natural systems
Activity 2: Temperature Inversions and Air Quality
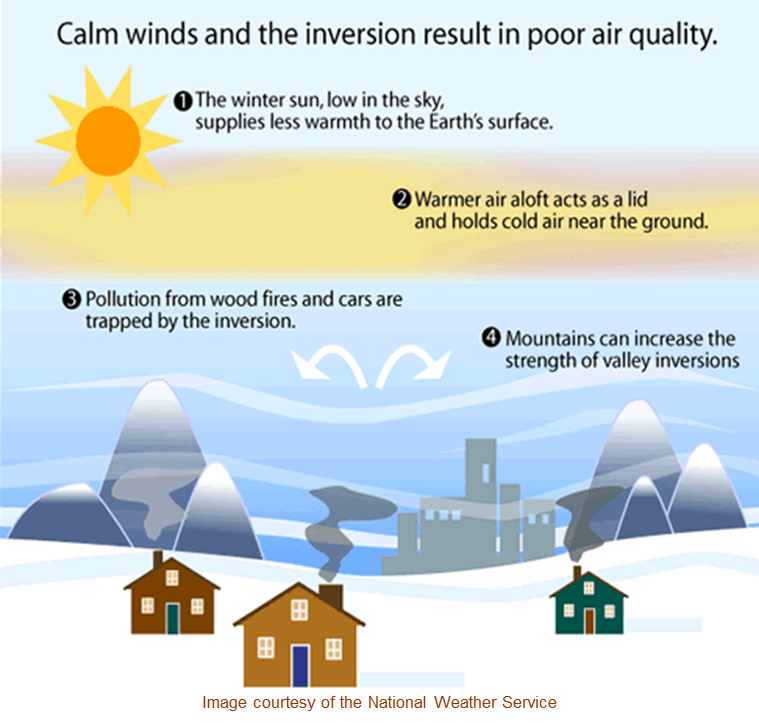
Real atmospheric data shows how winter inversions trap cold air near the ground, preventing pollutant dispersion. Students track Air Quality Index rising from 45 (good) to 165 (unhealthy) as the inversion strengthens over five days, connecting weather patterns to public health.
- MS-ESS2-5: Collect data to provide evidence for how the motions and complex interactions of air masses results in changes in weather conditions
- MS-ESS3-2: Analyze and interpret data on natural hazards to forecast future catastrophic events
- HS-ESS2-4: Use a model to describe how variations in the flow of energy into and out of Earth's systems result in changes in climate
- HS-ESS3-1: Construct an explanation based on evidence for how the availability of natural resources, occurrence of natural hazards, and changes in climate have influenced human activity
Activity 3: Temperature and Power Demand

Seven days of utility company data reveals the inverse relationship between temperature and electricity consumption. Students see demand surge 60% during extreme cold and explain why grids become vulnerable precisely when heating is most critical.
- MS-PS3-3: Apply scientific principles to design, construct, and test a device that either minimizes or maximizes thermal energy transfer
- MS-ESS3-3: Apply scientific principles to design a method for monitoring and minimizing a human impact on the environment
- HS-PS3-3: Design, build, and refine a device that works within given constraints to convert one form of energy into another form of energy
- HS-ESS3-2: Evaluate competing design solutions for developing, managing, and utilizing energy and mineral resources based on cost-benefit ratios
Your Complete FREE Resource Package
Each activity includes:
- Multi-variable color graphs with authentic data from NOAA, EPA, and utility companies
- Scaffolded CER prompts guiding students through claim development, evidence selection, and scientific reasoning
- Standards alignment for NGSS
- Complete teacher answer keys with detailed sample responses demonstrating strong CER structure
- Background information explaining the science behind each phenomenon
Ready to bring winter science to life in your classroom?
[Download FREE Winter CER Activities]
What Makes These Activities Work
Each activity features interactive graphs with real or research-based data, comprehensive background information that builds content knowledge, and detailed sample responses modeling sophisticated scientific reasoning. They're aligned to both NGSS and TEKS standards across middle and high school levels, addressing topics from molecular structure to ecosystem dynamics.
The winter context provides natural engagement, but the real learning comes from the CER framework that guides students through making specific claims, citing precise evidence, and explaining the scientific principles connecting their evidence to conclusions.
Extend Learning with Hands-On Investigation
Want deeper exploration? Our related resources provide multiple pathways:
Additional FREE Phenomenon Activities:


Easily jump into a discussion of natural disasters, weather, and climate with our free YouTube videos. Every video comes with a complete student worksheet and teacher answer key. Standards alignment is already handled for you so what are you waiting for?
✔ Learn why natural disaster happen and how they are different from a hazard
✔ Clear up any confusion of weather vs climate
Weather & Storms Lab Stations

This student-focused lab station activity focused on weather events will keep your middle school students engaged and learning! These engaging stations will encourage students to read, write, make, and so much more. Each station is tied to key concepts, interesting phenomena, and practices skills so your students will thrive. Spark discussions and a love of science in your classroom!
✔ Weather Maps, Storm Formation, Cold & Warm Fronts
✔ Historical Weather Events, Key Vocabulary
✔ Practice Sets, Graph Making, & More!
Extreme Weather Events Science Phenomena

✔ Review recent news coverage or footage of hurricanes, tornadoes, or severe storms
✔ Identify conditions of different types of extreme weather events
✔ Compare weather events & more!
Winter Science Challenges
Arctic Adaptations: Research Project & Reading Article

- Informative text over many kinds of Arctic Adaptations.
- Complete research project on an animal your students select!
Candlelight Chemistry: Reading Article & Lab

- Informative text over the chemistry of Candles.
- Complete lab where students make and test their own candles!
Physics of Winter Sports: Research Project & Reading Article

- Informative text over many kinds of Winter Sports (Snowboarding, Ice Skating, Bobsledding, & More!)
- Complete research project on a sport your students select!
- Additional Free-Body Diagram Challenge
Implementation Strategies
Use these activities as engaging returns from snow days, school closures, to kick start the day, authentic test preparation during cold wintery days, or differentiated stations when you need flexible options. The varying difficulty levels will allow you to match activities to your curriculum needs and student readiness.

All of these resources are included in our science libraries. Explore everything we have to offer with a FREE school or district pilot! This includes all of our standards-aligned middle and high school resources.